Geospatial Statistics Dashboard The Geoportal Statistics dashboard provides a comprehensive view of products and data downloaded by the various users. The Geospatial Statistics dashboard provides: • Reports on number of map products uploaded • Reports on number of products downloaded filtered by product type, entity name, date range, number of downloads and geographic area • Reports on geo-processing tasks, filtered by download type, entity name, date range and number of downloads, that are initiated by different user groups • Geo-processing task statistics such as the vector and raster downloads • Reports on access to the map viewer The Geoportal Statistics dashboard consists of the following tabs: • Visitors • Site Features • System Health • ArcGIS Monitoring Click one of these tabs to open the related section of the Geoportal Statistics dashboard. Filtering the Reports The reports in the dashboard can be filtered by date and the number of records you wish to see. • 
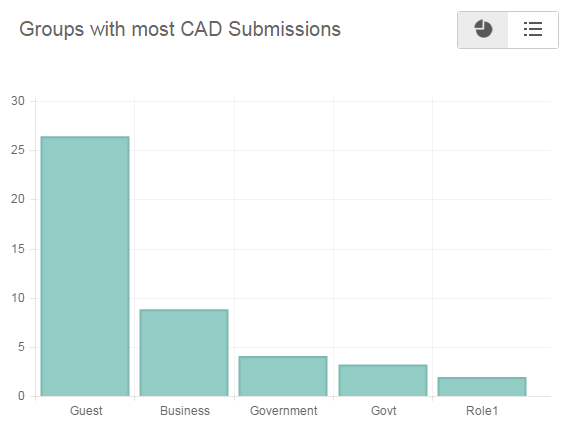
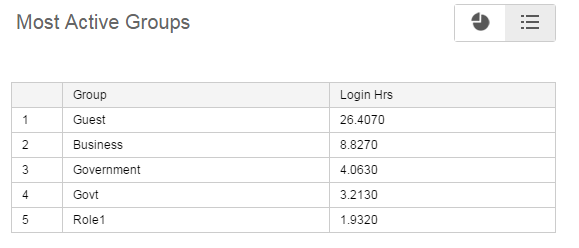
To determine the number of records to be displayed in each statistic in the dashboard, select a number from the No of Records drop-down located at the top of screen. • To filter the reports by date, specify the start date and end date in the date fields located at the top of the screen. Viewing the Reports in Tabular and Graphical Format The reports in the dashboard can be viewed either in tabular or graphical format. • To view the reports in tabular format, click . • To view the reports in graphical format, click . Figure 76 An example of a report in graphical format Figure 77 An example of a report in tabular format Printing Reports To print the displayed records, click located at the top of the screen.