The Results window displays multiple columns of information for each item in a window at the bottom of the map viewer. Information displays in the Results window as the result of a search or selection on the map. Additional tools are available to you on the Results window. You can also access some of them by selecting the More drop-down menu  . In addition, you can access record-related tools using the Other Options button
  for the record. As the tools in the Results window are configurable by the administrator, you will only be able to view the tools configured for your role. See their descriptions below in Table 18. In addition, the availability of a tool depends on your mode of access (basic/advanced). For more information on basic/advanced tools, See Basic/Advanced Mode
The height of the Results window changes as per the records displayed. If the results returned are less than 10, the Results window occupy less space. Also, when the user hovers the mouse out of the result grid the result grid becomes translucent.
 |
|
|
Closes that group of the Results window and removes those features from the map.
|
|
|
|
||
|
|
||
|
|
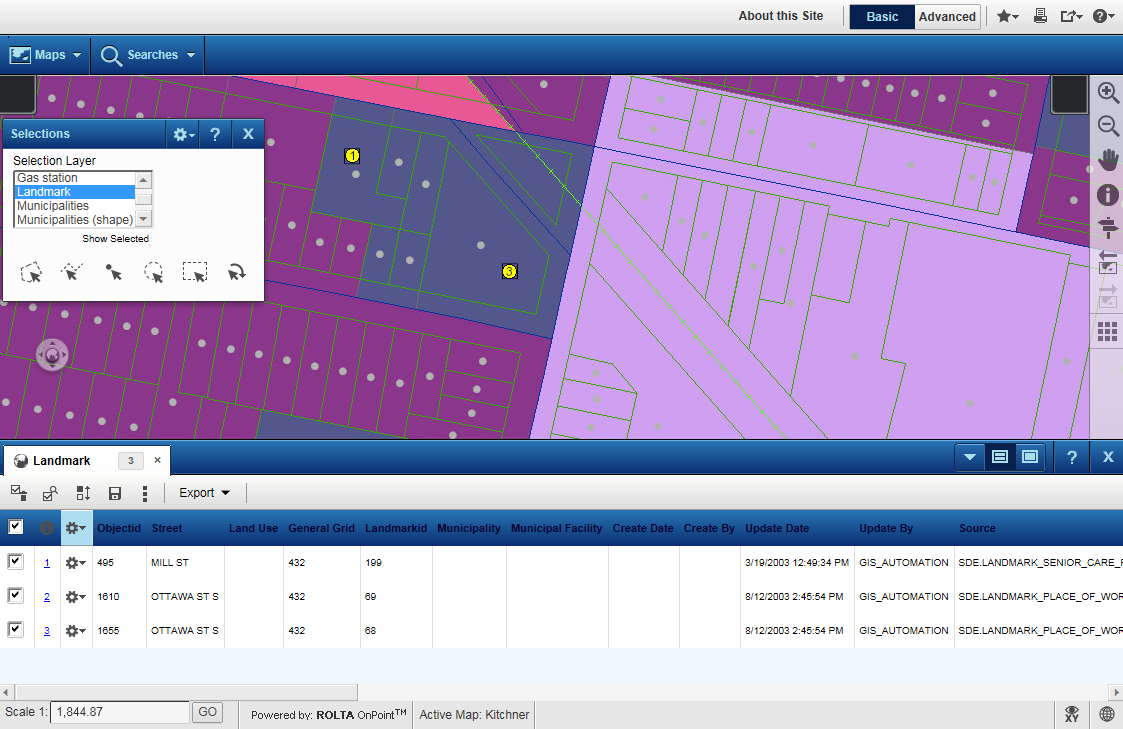
This is the default view of the Results window where the map is visible in the upper section of the screen and the Results window is visible in the lower section of the screen.
|
|
|
|
In Full view, the Results window is displayed on the entire screen. This enables you to view more records at a time.
|
|
|
|
Expand Results window
|
Expands the Results window to display search or selection results.
|
|
|
Remove selected
|
Removes only selected items from the list and from the map.
|
|
|
Zoom to selected
|
Zooms the map to a level where all items selected in the list or group display in the map.
|
|
|
Toggle active selection
|
Clears the check box for currently selected features and selects the check box for features not selected.
|
|
|
Save selections
|
Saves the list so you can display it at a later time. Lists can be saved as public or private.
|
|
|
Highlights visible features on the map in the Results window and displays the selections on the top of the Results Window. For more information on the Highlight feature, see Highlighting results related to the currently displayed map features
|
|
|
|
Statistical tool
|
Calculates statistics for numeric and geometric fields. This tool is available in the More drop-down menu.
|
|
|
Toggle indexing
|
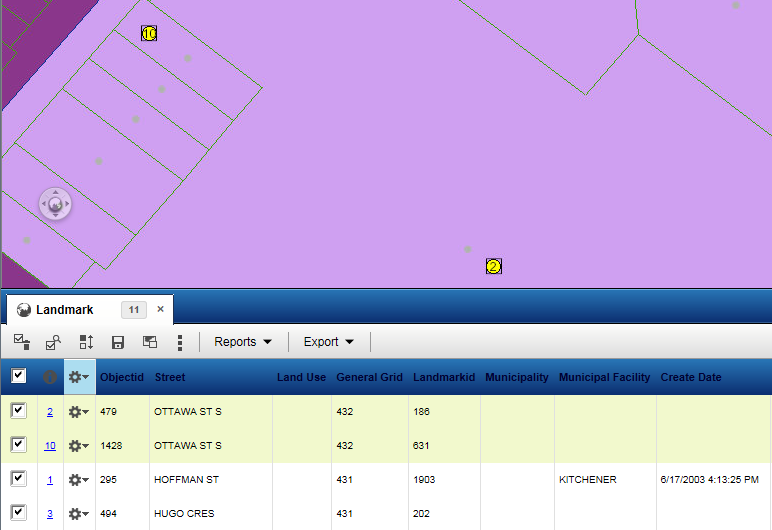
Selected features on the map will have a map symbol with a number that corresponds to the number listed in the list. Clicking the list number displays additional information about that feature. If the number of selected items exceeds what can be shown on the list, additional pages will be available and as you move to the next page, the index labeling on the map will change to match the list. This labeling can be turned off by clicking the Toggle Indexing option. This tool is available in the More drop-down menu.
|
|
|
Zooms the map to a level where all items in the list display in the map regardless of whether they have their check box selected or not. This tool is available in the More drop-down menu.
|
|
|
|
Clear buffer rings
|
Removes any buffer rings that were added to the map previously. This tool is available in the More drop-down menu.
|
|
|
Document viewer
|
Opens a new window with documents or maps that can be viewed or purchased. This tool is available in the More drop-down menu.
|
|
|
Opens the Chart window so you can create a chart with map data. This tool is available in the More drop-down menu.
|
|
|
|
View Thematically
|
Helps assign distinguishing colors or symbols to map features according to the value of that feature to help you recognize patterns or trends. This tool is available in the More drop-down menu. For more information on Thematic mapping, see Using thematic mapping
|
|
|
Edit Attributes
|
Helps you edit the attributes of the record. However, editing should be enabled on the layer in the OnPoint Administration Console.
|
|
|
Zoom to Feature
|
|
|
|
Clear Selection
|
Removes the selection from the map and the Result window
|
|
|
Show on Map
|
|
|
|
Exports selected results as a .kmz file. A .kmz file contains compressed keyhole markup language (kml) files, which can be viewed in applications that can open that file format, such as Google Earth. This drop-down contains two options—Export Selection to KMZ and Export All Selections to KMZ.
|
|
|
|
After performing a search or selection, click the Highlight tool in the upper left of the Results window to highlight the data entries on the Results window related to the features currently displayed on the map. The Results window refreshes and sorts the data entries so that those belonging to the currently displayed map features are near the top of the window.
 |
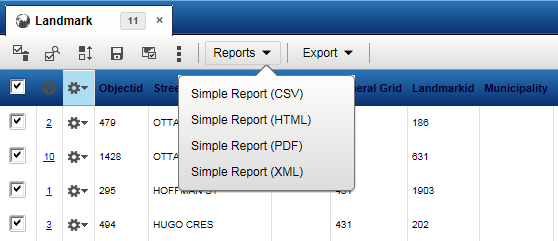
In the Results window, select the Reports drop-down menu. Select the report name to run the report using the data displaying in the window. For more information on the types of reports available, see Viewing reports.
 |
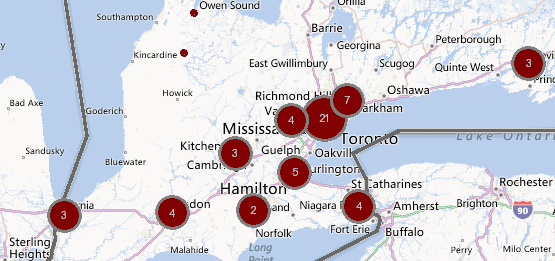
If your map administrator has enabled clusters for feature groups that display as points on the map, you will be able to see them represented as clusters after you have performed a search or selection (while the map is at a scale your administrator has configured for clusters). Clusters are groups of map features that display as one group when the map features occur close together. Cluster size changes with the scale of the map. The closer you zoom in, the less likely you will see clusters. If more than one group of map features has been set up to display in clusters, you will notice a Cluster drop-down menu on the Results window after performing a search or selection. See Figure 174 . Clusters can represent a number of map features or the sum of the numeric attributes belonging to a group of map features. See below for more information.
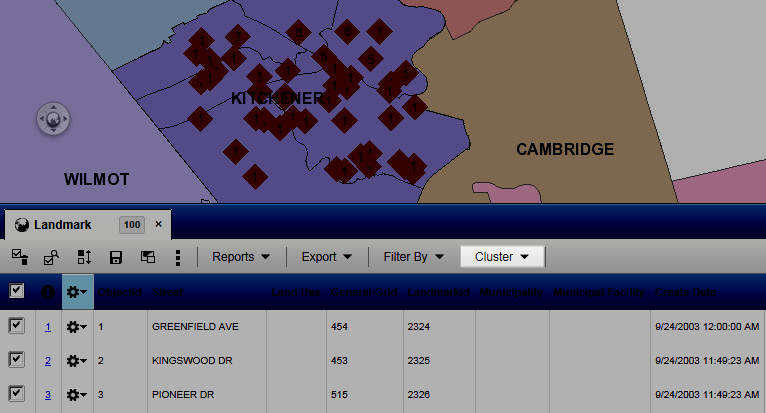 |
If a collection of points occur close together on the map, they are displayed as one symbol whose size is proportionate to the number of map features the cluster represents. The number of map features the cluster represents is displayed as a label. In the example shown in Figure 175 , each cluster represents a number of businesses.
 |
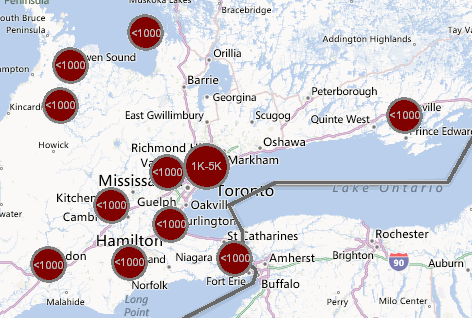
Clusters can also represent the sum of a numeric attribute that belongs to all the map features in the cluster. For example, if the map features the cluster represents are businesses, and each of these has a numeric attribute called No of employees, each cluster represents the total number of employees of all the businesses in the cluster. Each cluster would be labelled with the total number of employees the cluster represents.
 |
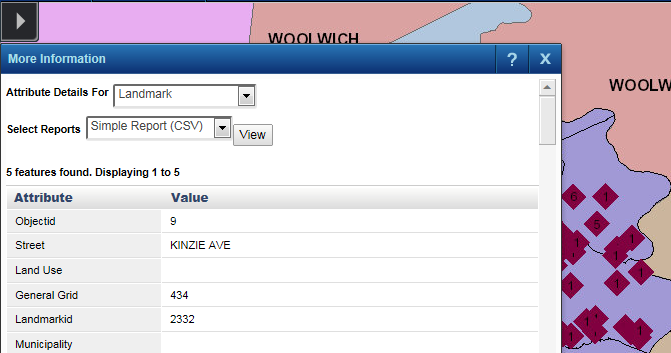
If you want to view more information about the map features grouped within a cluster, you can use the Identify tool. Select the Identify tool  on the toolbar of the map viewer and click the cluster for which you want to view more information. The list of map features belonging to the cluster appears in the More Information window.
|
•
|
If the group of map features to which the cluster belongs is not selected in the Attribute Details For list, then you must select it before being able to view any details for the cluster. For example, in Figure 177 , the map features belonging to the clusters shown are commercial sites, which is the feature group selected in Attribute Details For.
|
 |
You can expand or collapse the Results window to change its display mode. If configured, the Results window is collapsed by default to hide the search results. To change the display mode, click the Expand  or Collapse
  buttons that are available in the heading bar of the Results window.
|
|
 |
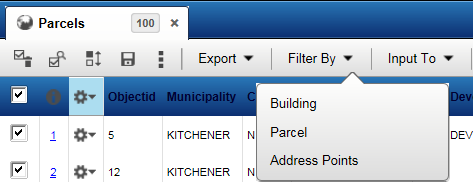
Searches can be used either to further narrow results from previous searches/selections or to use the results of one search/selection as the criteria for a second search. If configured, two buttons are available in the heading bar of the Results window. In the heading bar of the Results window, click the Filter By button and select the secondary search you want to run.
 |
|
•
|
This option lets you run a new search to further refine or narrow the number of items in the Results window.
|
|
•
|
If you have a list of shopping centers in the Results window, you could use a new search to find all banks that are within 500 meters of those shopping centers. The shopping center list would be further reduced to only include those centers that fit the bank distance criteria.
|
|
•
|
If you have a list of shopping centers in the Results window, you could use a community search to only show the shopping centers that are within a selected community.
|
|
•
|
This option allows you to run a search and use the items currently in the Results window as criteria for this new search.
|
|
•
|
If you have a list of shopping centers in the Results window, you could run a new search to find all banks that are within 500 meters of those shopping centers. Only those banks that fit the distance criteria to the shopping centers would show in the Results window.
|
|
•
|
If you have a list of shopping centers in the Results window, you could use a community search to show only those communities that have the listed shopping centers.
|
You can sort data by each column of data in ascending or descending order in the Results window if a double-arrow icon  displays in the column header.
|
•
|
In the Results window, click the column header whose data you want to sort. The data is then listed according to the order of that column.
|
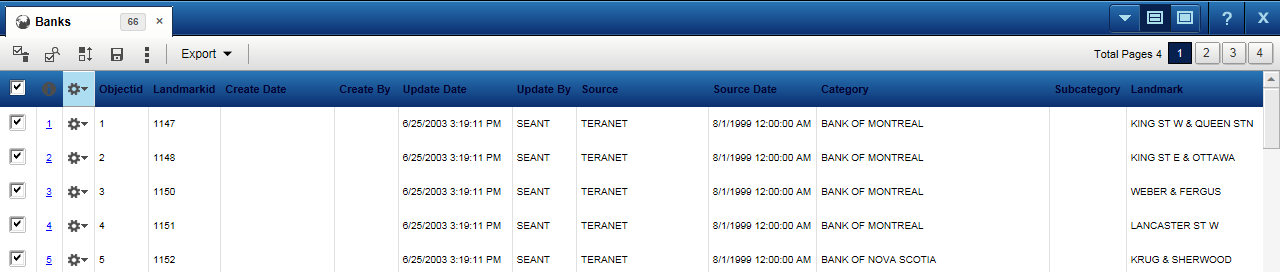
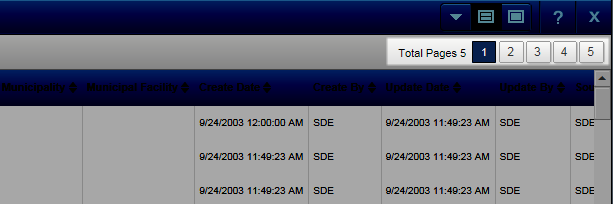
When the list of selected items opens, either the total number of pages or the total number of items display (depending on the selection window type). Only the items selected on the first page correspond to a number on the map. Click the page numbers at the top of the window to move to that page.
 |