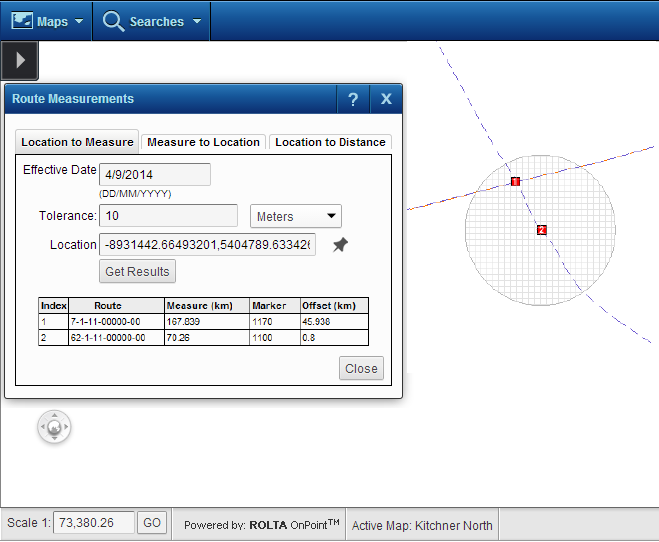
Plot a point on a route and assign a tolerance for the point, which is a buffer zone around the point. OnPoint returns the route identifier and the measure value at the point location and its X, Y coordinates. The data returned and what it represents varies with the linear referencing method (LRM) that is selected.
|
1.
|
|
2.
|
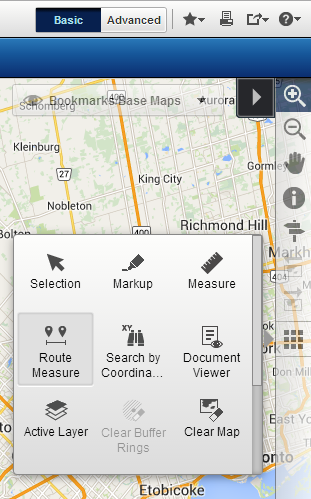
On the Map Tools pane, click the More Tools button and then select the Route Measure tool.
|
 |
|
3.
|
In Effective Date, you have the option of specifying an effective date for the measure value you want to find. This is not mandatory.
|
|
4.
|
In Tolerance, you have the option of specifying a radial distance around the point you plot. OnPoint searches for routes within this area. By default the unit of measure for Tolerance is Meters. Select a different unit of measure in the drop-down list to the right if required.
|
|
5.
|
In Location, click the pin icon
|
|
6.
|
Click the Get Results button.
|
|
•
|
Information about the nearest route or routes within the tolerance, the measure value of the point you plotted on the route, as well as other data, are displayed at the bottom of the Route Measurements window.
|
 |
|
1.
|
|
2.
|
On the Map Tools pane, click the More Tools button and then select the Route Measure tool.
|
|
|
|
4.
|
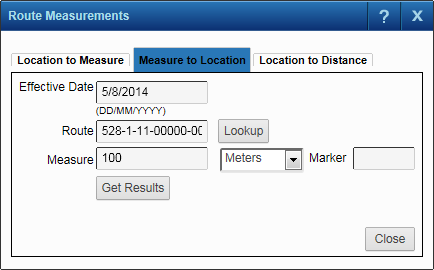
In Effective Date, you have the option of specifying an effective date for the location you want to find. This is not mandatory.
|
|
5.
|
In Route, specify the route identifier or select from a list that is automatically generated when you click the Lookup button.
|
|
6.
|
In the Network Key Lookup dialog box that appears, specify values in each of the fields or click the Lookup button in each to select an appropriate value from a list.
|
|
•
|
The fields that appear on the Network Key Lookup dialog box differ according to the LRM selected earlier.
|
|
7.
|
In Measure, specify the distance of the location (that you want to find) from the beginning of the route.
|
|
•
|
Although this is optional, you must specify either a measure in Measure or an identifier of a marker in Marker.
|
|
8.
|
In Marker, specify the identifier of the marker closest to the location you want to find.
|
|
•
|
Although this is optional, you must specify either a measure in Measure or an identifier of a marker in Marker.
|
|
9.
|
Click the Get Results button to find the location.
|
|
•
|
The X, Y coordinates and their coordinate system are displayed at the bottom of the Route Measurements window.
|
 |
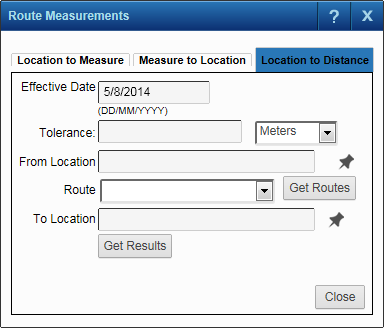
You plot a start and end location along the closest route or route within a tolerance, and OnPoint returns the distance between the two, the X, Y coordinates of the start and end locations, in addition to other data about the closest route markers. The data that is returned varies with the location reference method (LRM) that you select.
|
1.
|
|
2.
|
On the Map Tools pane, click the More Tools button and then select the Route Measure tool.
|
|
|
|
3.
|
In Effective Date, you have the option of specifying an effective date for the start and end points. This is not mandatory.
|
|
4.
|
In Tolerance, you have the option of specifying a radial distance around the start and end points you plot. OnPoint searches for routes within this area. By default the unit of measure for Tolerance is Meters. Select a different unit of measure in the drop-down list to the right if required.
|
|
5.
|
In From Location, click the pin icon
|
|
6.
|
|
7.
|
In To Location, click the pin icon
|
|
8.
|
Click the Get Results button.
|
|
•
|
Various measures are displayed at the bottom of the Route Measurements window, including the distance of the start and end points from the beginning of the route, and the distance between them. The measures that are obtained vary with the LRM selected.
|
 |