The ArcGIS Monitoring feature enables you to generate reports by retrieving the data from the ArcGIS Server log, which contains logs related to the events that occur in the server, and any errors associated with those events.
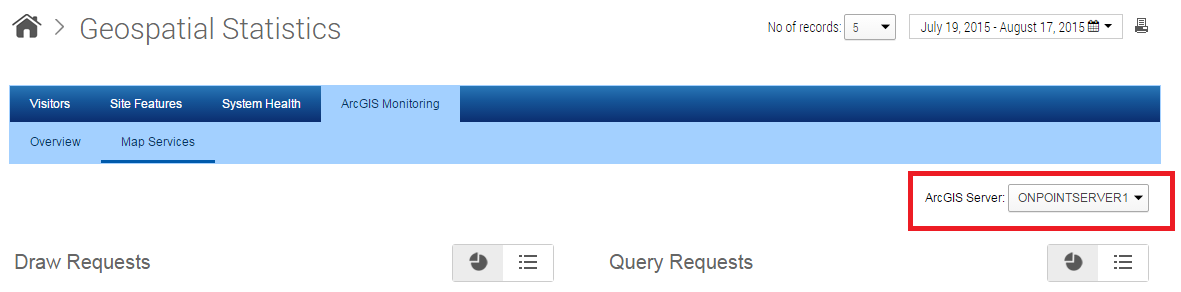
This section displays the various reports on map services for the selected ArcGIS server. You can select the required ArcGIS server from the drop-down list on the top-right corner of the Map Services section as shown in
Figure 95 .
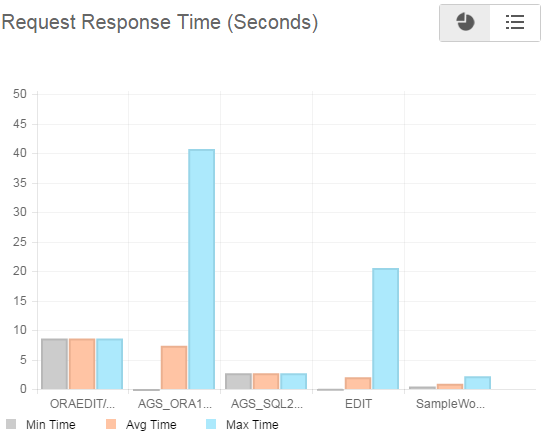
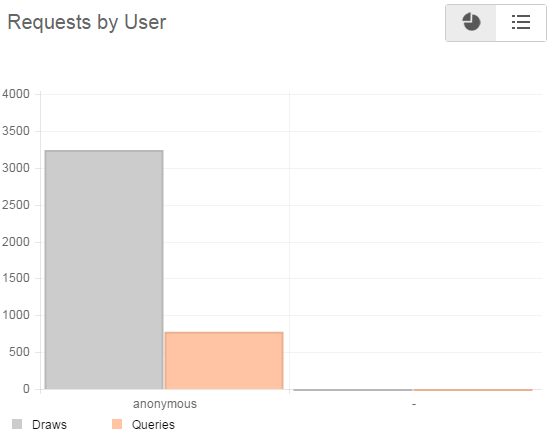
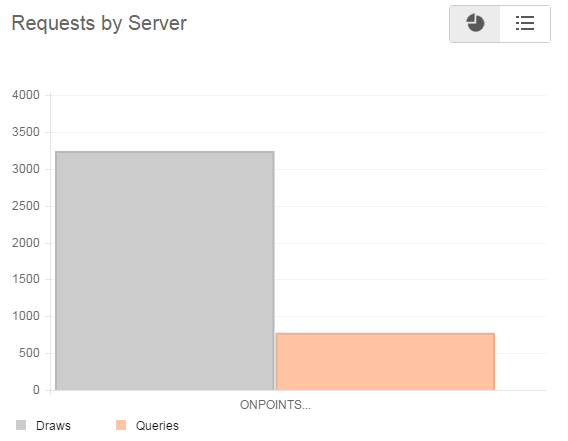
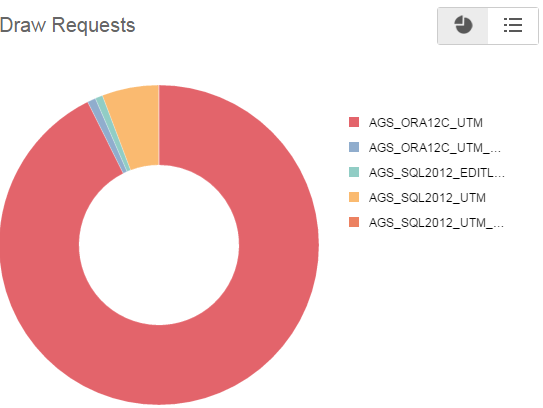
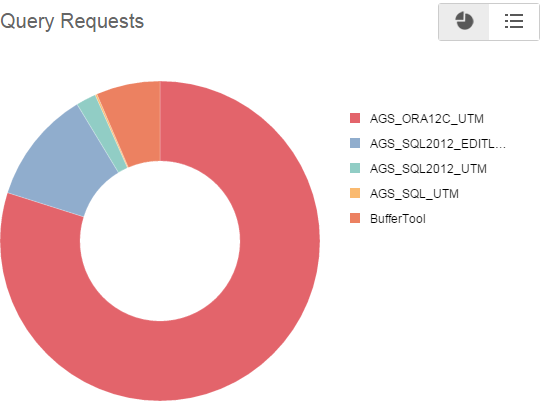
The reports on map services display the total number of draw and query requests on each map services; maximum, minimum and average time taken to respond to draw and query requests to each map services; and number of draw and query requests by different users.
 [
[